
One Screen Instead of Ten Apps: What a Custom Business Dashboard Looks Like
It's 7:45 on a Tuesday. Before anyone does real work, they open the CRM to see which deals moved. Then the project app to see what's due. Then Slack or Teams to find out who's waiting on them. Then the calendar. Then QuickBooks to see if yesterday's payments landed. Then a spreadsheet somebody built to track unpaid invoices.
Multiply that by everyone on payroll, every morning. That's a lot of people starting the day just figuring out what needs attention.
None of those tools are the problem. The problem is that nobody can see across them without clicking through all of them.
TL;DR: A custom dashboard pulls the important information out of the apps you already use and puts it on one screen. Each person sees what matters for their role, a short email each morning gives them the highlights, and nothing about your current software has to change.
One view: what's due, what's late, and who's waiting on whom, pulled from roughly ten apps onto one screen.
Your tools stay: for the most part, if your software has an API or a connector, it can feed the dashboard.
Built per role: the owner, marketing lead, bookkeeper, project manager, and salesperson each see a different first screen.
Morning email: a short summary of the highlights, with one click into the full dashboard for today and previous days.
Read-only first: the dashboard looks at your systems without changing anything in them.
First, what we mean by a dashboard
A dashboard here is one screen showing the handful of things you'd otherwise go looking for. Not every number, just what needs attention today.
A typical business runs on about ten apps, something like this:
CRM: HubSpot, Salesforce, Pipedrive, or similar, where leads and deals live.
Project management: systems like Asana, Monday, or ClickUp.
Team chat: Slack or Microsoft Teams.
Email and calendar: Gmail or Outlook, with Google Calendar or Outlook's calendar.
Accounting and payments: QuickBooks or Xero, plus Stripe or Square for taking payments.
Marketing: Google Analytics and whatever ad platforms you run.
Everything else: booking, phones, help desk, Google Drive or SharePoint, payroll like Gusto or ADP, or a POS.
A dashboard reads from those and answers simple questions. What's due today? Which meetings are coming up? Which tasks are waiting on approval? How much revenue got recorded today? Which invoices are more than 10 days overdue?
Don't forget team messages
A lot of what needs attention never becomes a task. It's a Slack message where someone tagged you with a question. It's a Teams request that's been sitting since yesterday afternoon.
A dashboard can pull those up right next to the tasks: mentions waiting on you, requests waiting on someone on your team, and messages that still need a reply.
Your apps stay. They just report in one place.
If your bookkeeper knows QuickBooks cold, keep it. The dashboard sits on top. And the apps above are examples, not requirements. The Command Center can connect to almost any system that has an API. An API is simply a door a piece of software leaves open so other software can ask it for information, with permission.
Many systems are easier still, because a connection already exists:
Native integrations: connections the software company built itself.
Zapier and Make: the duct tape between business apps, with connectors for thousands of products.
MCP connectors: MCP (Model Context Protocol) is a newer standard that lets AI tools plug into business software like a charger into a phone. For you, it means more tools connect with less custom work.
The simple way to think about it: if your tool has an API or a connector, it can usually feed the dashboard. If not, it's not automatically a dead end, but it's the first thing we'd look at. Some older or niche software is stubborn, so we won't promise every tool connects perfectly.
Read-only first, always
The first version of your dashboard never writes to your systems. It can't delete a task, change an invoice, move a deal, or send a message.
Reading is where most of the value is, with almost none of the risk. Write access and automation can come later, one piece at a time, with a person in the loop on anything that matters. More on that below.
If a software rollout has ever broken something on you, this part should let you breathe.
Every role should see a different screen
A dashboard that shows everyone the same thing ends up useful to no one. Your salesperson doesn't need the aging report. So each screen looks a little different and pulls from different systems.
These are examples, not a fixed menu. Yours would be built around the tools you actually use.
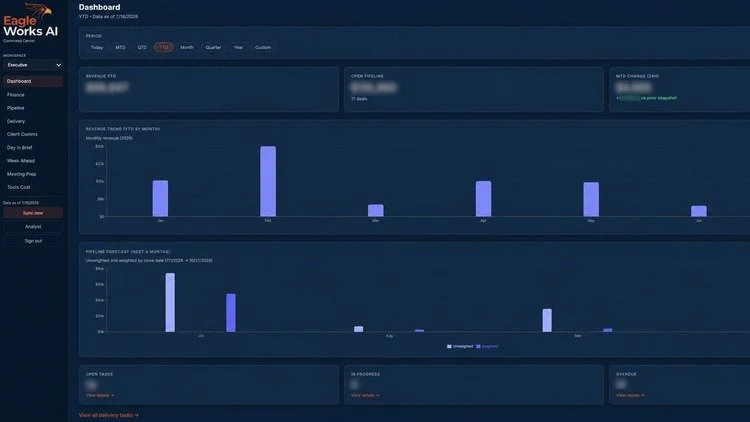
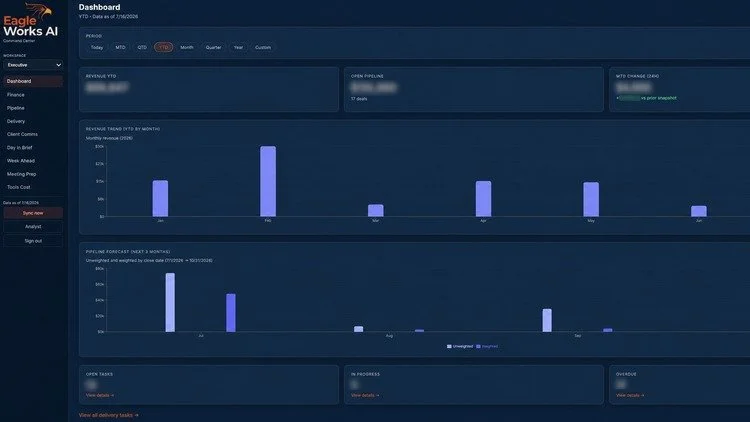
The owner or GM
The whole business in one glance, whether you're in the office or at the lake.
What you see first: revenue from QuickBooks or Xero, pipeline and forecast from your CRM, and anything flagged as a risk this week.
What you're alerted on: invoices more than 10 days overdue, a big deal that slipped a stage, or a request that's waited on you too long.
Your morning email: yesterday's revenue recorded, cash coming in, tasks and messages waiting on your approval, and today's meetings.
Marketing
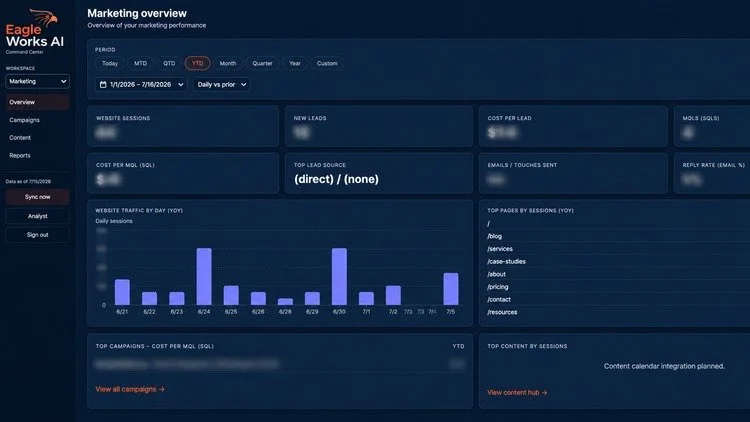
Is the money turning into leads?
What they see first: website sessions from Google Analytics, spend from your ad platforms, new leads as they land in the CRM, and cost per lead.
What they're alerted on: cost per lead climbing past a number you set, or a week where leads drop off.
Their morning email: yesterday's leads by source, what's scheduled to go out today, and any campaign that needs a decision.
Finance or the office manager
Receivables at a glance, without building a report by hand.
What they see first: revenue recorded today and open invoices from QuickBooks or Xero, sorted by how late they are, next to payments received through Stripe or Square.
What they're alerted on: anything crossing 10 days overdue, a payment that didn't land when expected, or payroll coming due.
Their morning email: a short list of who to follow up with today and what came in yesterday.
The project manager
What they see first: every open client task from Asana, Monday, or ClickUp, grouped by client and due date, plus Slack or Teams requests waiting on the team.
What they're alerted on: tasks past due, work waiting on approval, and client messages with no reply.
Their morning email: what's due today, what slipped yesterday, and this week's client meetings.
The salesperson
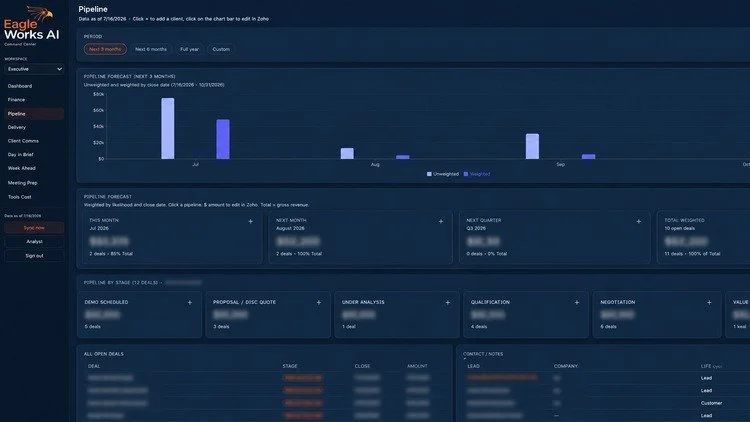
What they see first: their deals by stage from HubSpot, Salesforce, Pipedrive, or whatever CRM you run, weighted by close date.
What they're alerted on: a deal with no activity in a set number of days, or a proposal still unanswered.
Their morning email: today's calls and meetings from the calendar, follow-ups due, and deals expected to close this month.
Everyone else on the team
What they see first: what's due today, which meetings are coming up, and messages waiting on their reply.
What they're alerted on: something assigned to them that's due soon or already late, or a mention they haven't answered.
Their morning email: their day, in about five lines.
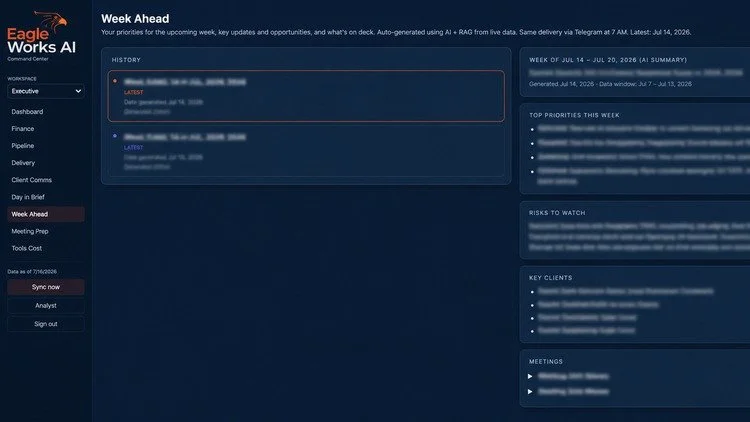
The pattern is the same. Individuals see their own work. Managers also see what's waiting on them: tasks awaiting approval, revenue recorded that day, invoices past due, and requests nobody has picked up.
The morning email that does the checking for you
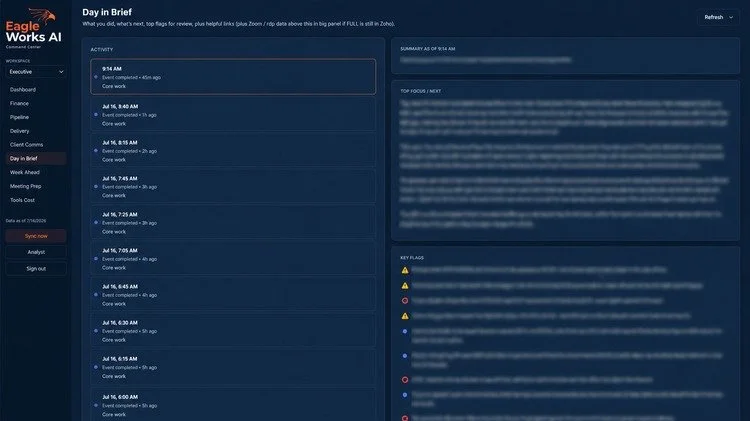
Most people open their email before any dashboard, so the highlights come to them. A short summary lands before they sit down: the numbers that moved, the meetings coming up, and what needs attention. One click opens the full dashboard, where they can see today's update and look back through previous days.
Later: workflows that work between your systems
Once the dashboard is earning its keep, you can add workflows that move information between your systems, not just show it.
A good example: a deal gets marked closed-won in HubSpot, Salesforce, or whatever CRM you run. Today, someone retypes the customer's details into the accounting system and digs up an old contract to copy.
Instead, there's a button in the Command Center, or a quick chat request like "Set up the account for Smith Plumbing" (a made-up name). It pulls the customer details from the CRM, creates the customer in QuickBooks or Xero so they're ready to bill, and drafts a statement of work or contract from your template.
Two more in the same spirit:
New client kickoff: creates the project in Asana, Monday, or ClickUp and opens a Slack or Teams channel for it.
Overdue invoice: once an invoice passes 10 days late, a polite reminder gets drafted for your bookkeeper to review and send.
Read-only-first thinking still holds. These get added one at a time, as automation or custom app modules, with a person in the loop. Pressing the button or sending the request is the approval. Anything headed to a client, like a contract or SOW, gets reviewed before it goes out.
None of that is where you start, though. The first step is the connected dashboard. Once you can see across your systems, it's much easier to spot which handoff is worth automating first.
When you probably don't need this
If your team mostly lives in one or two apps, and one of them already has a decent built-in report, use that. A custom build isn't worth it to save three clicks.
The dashboard earns its keep when nobody has the full picture without asking around.
Where to start this week
Pick one person on your team and ask them a simple question: "What do you check every morning before you can start working, and where do you check it?"
Write down the apps they name and what they look for in each. That list is a first draft of their dashboard.
If you want help turning it into the real thing, that's what the AIOS Command Center is for. Most engagements start with a Payoff Audit, so the first screen we build is aimed at your biggest bottleneck, and the audit is credited in full toward the build. If you'd rather just talk it through, reach out and tell us what your mornings look like.
Frequently asked questions
Do we have to replace our software?
No. The dashboard reads from the tools you already use. If something works, keep it.
What if our tool isn't on a list somewhere?
Ask whether it has an API or a Zapier or Make connector. If it does, it can usually feed the dashboard. If not, we'll look at it with you before promising anything.
Is it safe?
The first version is read-only, so it changes nothing in your systems. Workflows that change things come later, one at a time, and only run when a person approves them.
How long until we see it?
The first module is typically live in 1-2 weeks.
Can it do things, not just show things?
Eventually, yes. After the dashboard, you can add workflows one at a time, like setting up a customer in your accounting system when a deal closes. We can also add links that connect to the exact application area where the data was sourced.
Will everyone see the same thing?
No. Each role gets its own view. An owner sees revenue, pipeline, and forecast with the KPIs that matter to them. A team member sees what is relevant to the department they work in. These dashboards are truly customized for each person on your team.
EagleWorks AI is an AI consulting firm in Opelika, Alabama, helping Auburn and Opelika area businesses put AI to work on real outcomes. Practical AI. No hype. Just ROI.